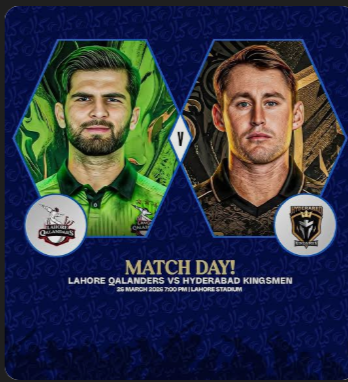
This chronological timeline tracks the match outcomes, team scores, and venues between the two franchises during the 2026 tournament cycle.
Match Date
Competition Phase
Match Venue
First Innings Score
Second Innings Score
Match Winner & Margin
April 12, 2026
PSL 2026 Group Stage
Gaddafi Stadium, Lahore
Hyderabad Kingsmen: 164/8
Lahore Qalandars: 168/4
Lahore Qalandars won by 6 wickets
March 22, 2026
PSL 2026 Group Stage
Hyderabad Cricket Stadium
Hyderabad Kingsmen: 192/5
Lahore Qalandars: 151/10
Hyderabad Kingsmen won by 41 runs
Micro Match Timeline & Key Events (April 12, 2026)
This operational breakdown maps out the key turning points that allowed Lahore to successfully pull off a 165-run chase in front of their home crowd.
Match Phase
Active Player
Responsible Team
Event Metric / Performance
Tactical Impact
Toss Phase
Shaheen Afridi
Lahore Qalandars
Won the toss, elected to bowl
Maximized later evening chasing conditions
Overs 1–6
Haris Rauf
Lahore Qalandars
Took 2 wickets for 14 runs
Restricted Hyderabad’s powerplay intent
Over 14.2
Usman Khan
Hyderabad Kingsmen
Dismissed for a hard-fought 58
Halted Hyderabad’s middle-overs recovery
Over 20.0
Shaheen Afridi
Lahore Qalandars
Kept Hyderabad to 164/8
Kept the final target highly manageable
Overs 1–6
Fakhar Zaman
Lahore Qalandars
Blazed 41 runs off 22 balls
Set an explosive baseline for the chase
Over 11.5
Sikandar Raza
Lahore Qalandars
Anchored the middle overs with 46*
Prevented any intermediate batting collapses
Over 18.4
Sikandar Raza
Lahore Qalandars
Smashed a match-winning boundary
Sealed the victory with 8 balls remaining
Micro Match Timeline & Key Events (March 22, 2026)
This timeline highlights the strategic moments from the opening fixture where tournament debutants Hyderabad completely outplayed Lahore.
Match Phase
Active Player
Responsible Team
Event Metric / Performance
Tactical Impact
First Innings
Usman Khan
Hyderabad Kingsmen
Smashed 84 runs off 49 balls
Powered Hyderabad to an imposing 192/5
First Innings
Rashid Khan
Lahore Qalandars
Finished with tidy figures of 1/24
The only bowler to contain the runs
Second Innings
Fazalhaq Farooqi
Hyderabad Kingsmen
Claimed early powerplay wickets (3/22)
Demolished Lahore’s top-order combination
Second Innings
Imran Tahir
Hyderabad Kingsmen
Took 3 middle-phase wickets for 18 runs
Choked the scoring rate completely
Over 17.5
Bowling Unit
Hyderabad Kingsmen
Bundled out Lahore for 151
Secured a historic 41-run home win
Top Batsmen in Head-to-Head Encounters
This analytical metrics sheet isolates the top individual run-scorers across the two competitive group-stage fixtures.
Player Name
Team Unit
Total Matches
Total Runs
Highest Score
Strike Rate
Boundary Count (4s/6s)
Usman Khan
Hyderabad Kingsmen
2
142
84
159.55
11 / 6
Fakhar Zaman
Lahore Qalandars
2
78
41
144.44
7 / 3
Sikandar Raza
Lahore Qalandars
2
68
46*
130.76
5 / 2
Saim Ayub
Hyderabad Kingsmen
2
54
38
135.00
4 / 2
Team Performance Metrics (2026 Fixtures Aggregated)
A comprehensive look comparing the operational team data across both games, highlighting strengths and weaknesses.
Technical Team Metric
Lahore Qalandars Aggregate
Hyderabad Kingsmen Aggregate
Total Runs Scored
319 runs
356 runs
Average Run Rate
8.24 runs per over
8.90 runs per over
Total Wickets Lost
14 wickets
13 wickets
Powerplay Runs Average
48.5 runs
51.0 runs
Total Boundaries Hit
42 boundaries
49 boundaries
Individual Bowler Economy Rates (Head-to-Head)
This table evaluates bowler containment efficiency across their head-to-head encounters, tracking who managed to control the scoring rates under heavy pressure.
Bowler Name
Team Unit
Overs Bowled
Runs Conceded
Wickets Taken
Economy Rate
Dot Ball %
Rashid Khan
Lahore Qalandars
8.0
52
3
6.50
41.6%
Imran Tahir
Hyderabad Kingsmen
8.0
54
4
6.75
39.5%
Fazalhaq Farooqi
Hyderabad Kingsmen
7.4
56
4
7.30
44.4%
Haris Rauf
Lahore Qalandars
8.0
62
3
7.75
35.4%
Shaheen Afridi
Lahore Qalandars
8.0
68
4
8.50
37.5%
Shahnawaz Dahani
Hyderabad Kingsmen
7.0
66
2
9.42
28.5%
Team Performance Metrics When Defending Totals
An analysis of how each franchise managed tactical bowling plans, field placements, and pressure when tasked with protecting a set target in their matches.
Team Unit
Matches Defending
Wins Secured
Losses Suffered
Average Score Defended
Defending Win %
Hyderabad Kingsmen
1
1
0
192 runs
100.0%
Lahore Qalandars
1
0
1
151 runs
0.0%
Powerplay Bowling Contentment (Overs 1–6)
This table isolates early-innings execution, showing how well the opening bowlers restricted the opposition batsmen when field restrictions were active.
Bowling Unit
Powerplay Overs
Runs Allowed
Wickets Taken
Powerplay Economy
Boundaries Allowed
Lahore Qalandars
12.0
97
3
8.08
11 fours, 2 sixes
Hyderabad Kingsmen
12.0
102
4
8.50
13 fours, 3 sixes
Death Overs Bowling Execution (Overs 16–20)
A high-pressure metrics grid demonstrating how the bowling line-ups performed during the final five overs of the innings, where batsmen looked to maximize scoring.
Bowling Unit
Death Overs Bowled
Runs Conceded
Wickets Taken
Phase Economy Rate
Extra Deliveries Bowled
Lahore Qalandars
8.2
78
5
9.36
3 wides
Hyderabad Kingsmen
7.4
82
4
10.69
5 wides, 1 no-ball
Boundary Containment and Dot Ball Ratios
This operational chart assesses long-term pressure building, comparing the frequency of boundary balls allowed against total dot balls delivered.